Data is key to designing solutions aimed at reducing poverty in India
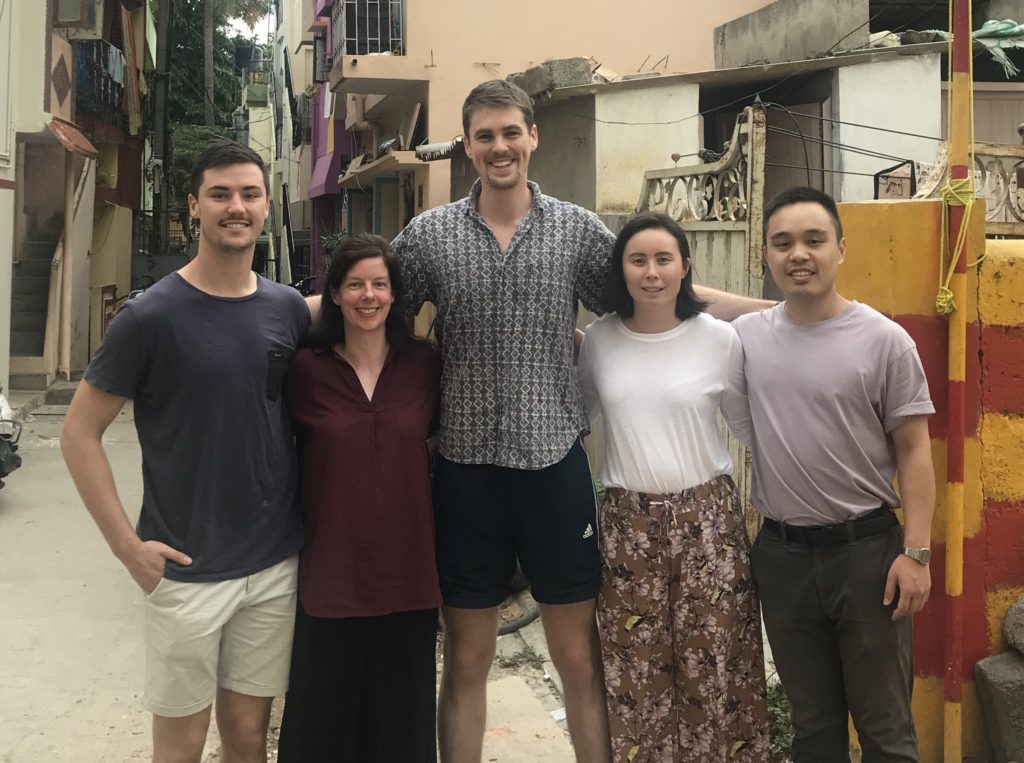
AECOM’s Australia and New Zealand partners with Pollinate Group to support employees wanting to take time to #GiveBack. This year, five employees participated on the 50th Professional Fellowship Program. As they return from their journeys, we’re following their stories through the #AECOMBlueprint blog series. This is the second of a two-part blog series that chronicles an employee’s work through Pollinate Energy’s Professionals Fellowship Program over the last few weeks.
The last week and a half has been exceptionally busy. Since my last post, I’ve been allocated my project and dove head first into the challenge. My project, the Poverty Index Study, looks to identify feasible methods to measure the level of poverty in the urban slums that Pollinate services. Measuring poverty sheds light on the demographic serviced, measuring social impact, and is a metric used to apply for philanthropic grants.
When our group of four was initially allocated the project, we began with a design-thinking workshop. Given the overall project needed to be completed in a fortnight, it was important to work quickly and effectively. We spent time defining the real problem and coming up with the problem statement, “How might we quantify poverty within communities to support future initiatives to improve the quality of life for community members?”
To go about this, we spent the rest of last week venturing out to different urban slum communities and asking households about their quality of life and a list of their household possessions, which is a strong statistical indicator of their likelihood and levels of poverty. As part of this exercise, we managed to collect 50 sets of data from a whole range of households. Even before we’ll get around to analyzing the data later this week, it was clear that there was a range of poverty in differing communities. As an example, some households were using a candle for light, others solar, and some even had power from the grid.

Gathering all this data meant getting an opportunity to talk with a range of people and households. It was a humbling experience as I learned that most people were migrants from rural India, where drought has plagued the agricultural industry for a long time. We discussed the hardships of uprooting their former lives in search for work in the city, usually as construction workers and other unskilled labor, and leaving their families behind to move to a booming city with a rapidly growing population, but a severe lack of infrastructure. What surprised me the most was that in spite of this, they were so open and honest with complete strangers about their challenges and aspirations. It was clear that they were also proud of what they had built for themselves.
In the next few days, we will present our project findings in a report and template; but until then there’s plenty more data crunching to do!
Take a look back at my first blog post about this trip.


