


Re-imagining transit service in California’s Bay Area post-coronavirus
A transit recovery vision
In response to the unprecedented impacts of the coronavirus pandemic on public transportation ridership and operations, AECOM teamed with Seamless Bay Area to envision how transit services could adapt. After consulting with regional transit decision makers, the team has developed modeling tools that enable scenarios to forecast the potential impacts of the length of the coronavirus crisis and mode shifts through an equity lens. These scenarios forecast potential steps towards recovery with the goal of improving accessibility, connectivity and ridership.
Like many regions around the world, public transit in the Bay Area has been challenged immensely by the impacts of coronavirus. Six months after Bay Area counties first issued a shelter-at-home order, ridership remains over 75 percent below pre-pandemic levels[1], creating a fiscal crisis and forcing difficult service-provision decisions. The Bay Area’s 27 transit agencies are each grappling with these changing conditions. Recognizing their shared challenges, they have also begun to collaborate in unprecedented ways (Figure 1).
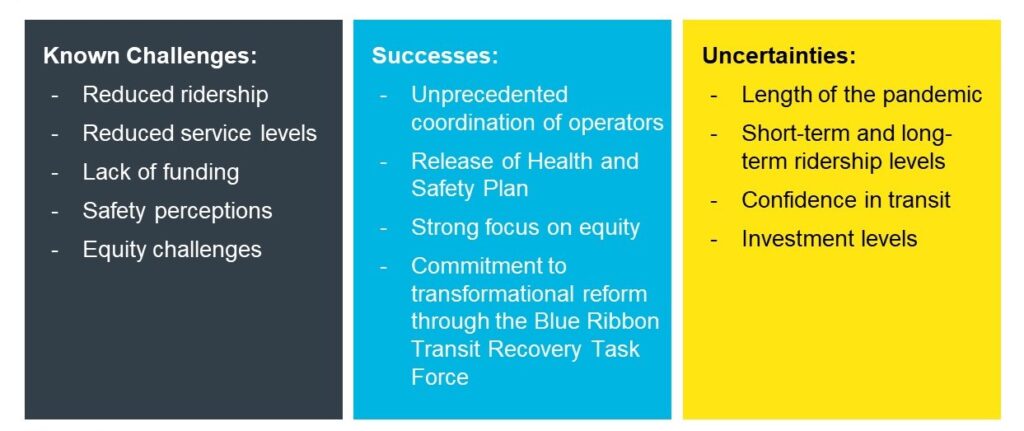
Figure 1. Summary of key Bay Area transit challenges, successes, and uncertainties that influenced the AECOM and Seamless Bay Area’s recovery vision analysis.
To support regional recovery efforts, including the recently established Blue Ribbon Transit Recovery Task Force, AECOM and Seamless Bay Area sought to better understand what a reimagined transit network could look like in the Bay Area, and what benefits it could provide. A vision for an integrated and optimized network was defined for this initiative by building upon existing transit agency long-term vision statements as shown in Figure 2.
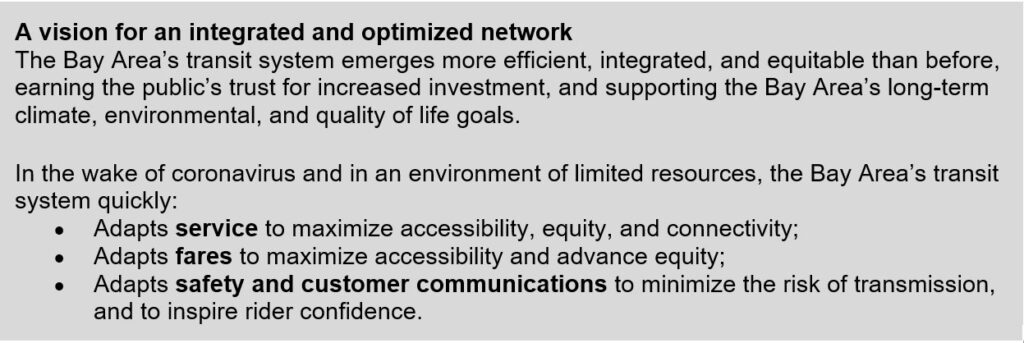
Figure 2. The network plan vision defined for this initiative builds upon and complements existing transit agency long-term vision statements.
The team developed three potential scenarios for analysis, based on varying combinations of network optimization and investment levels, and compared these to the pre-coronavirus baseline representing the “status quo” as well as to one another. These scenarios, shown in Figure 3, were then modeled with multiple factors to forecast likely future conditions, and to help forecast the effects of network optimization and investment.
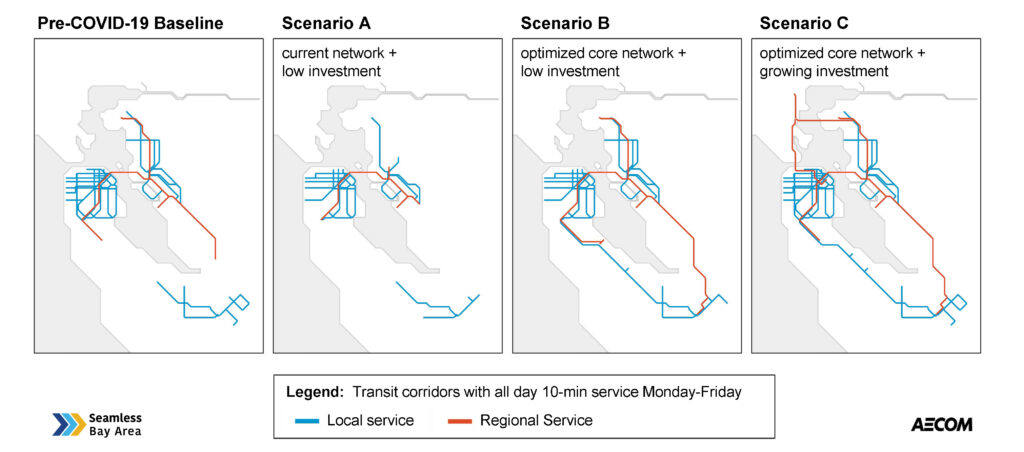
Figure 3. Scenarios B and C developed as part of the recovery vision sought to improve the extent of the frequent all-day, 10-minute network through targeted service changes. The goal was to provide greater transit accessibility to more people across the region.
The first of these scenarios (Scenario A) is based on service patterns as of June 2020 and assumes continued low investment in transit. For the alternate scenarios, the team identified a set of guiding principles for service changes with a particular focus on the preservation of service to Communities of Concern, as identified by the Metropolitan Transportation Commission (MTC), which include communities with concentrations of both minority and low-income residents, or that have a concentration of low-income residents and other disadvantage factors.[2]
Network changes were made to maintain a frequent network of trunk lines, provide greater regularity of service throughout the day, and build off of past efforts such as the megaregional rail vision developed by the San Francisco Bay Area Planning and Urban Research Association (SPUR) and AECOM, Seamless Bay Area’s Vision Map, TransForm’s ReX Vision, and the core service plans of the region’s transit operators. The result was an “optimized core network” service concept that corresponds to existing transit investment levels (Scenario B). The optimized core network is not intended to be a fully developed network plan, but rather a forecasting tool that supports collaboration and engagement among transit agencies and stakeholders at a greater scale. The team also identified how that network could be enhanced if major new sources of transit investment were approved (Scenario C).
The team estimated the potential impacts of these network permutations on accessibility to local and regional destinations, employment, and housing using geographic information systems (GIS). Additionally, AECOM’s MobiliticsTM[3] scenario planning tool was used to forecast how each network could perform under various possible economic recovery scenarios ranging from a quick 12-month coronavirus economic recovery (Economic Scenario Y), versus a more cautious 24-month economic recovery (Economic Scenario Z).
The result was a set of six future scenarios, as shown in Figure 4. The analysis yielded some significant forecast outputs for regional decision makers to consider as they chart a path towards a “better normal.”
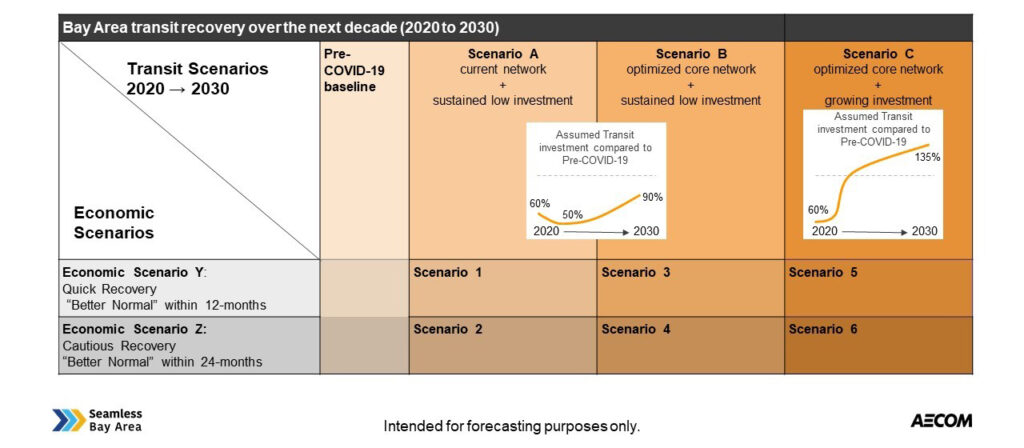
Figure 4. Summary of the three transit scenarios (A, B, and C) and two economic scenarios (Y and Z) developed as part of the Transit Recovery Vision, and the six resulting scenarios that were tested using AECOM’s scenario planning tool, Mobilitics.
As shown in Figure 5, the team developed a dashboard, in which variables can be toggled easily, to compare different scenarios, examine estimated outputs such as peak versus off-peak trips, isolate counties/districts/and degrees of Communities of Concern, and evaluate estimated accessibility by employment or household. View our video here to see a preview of this dashboard.
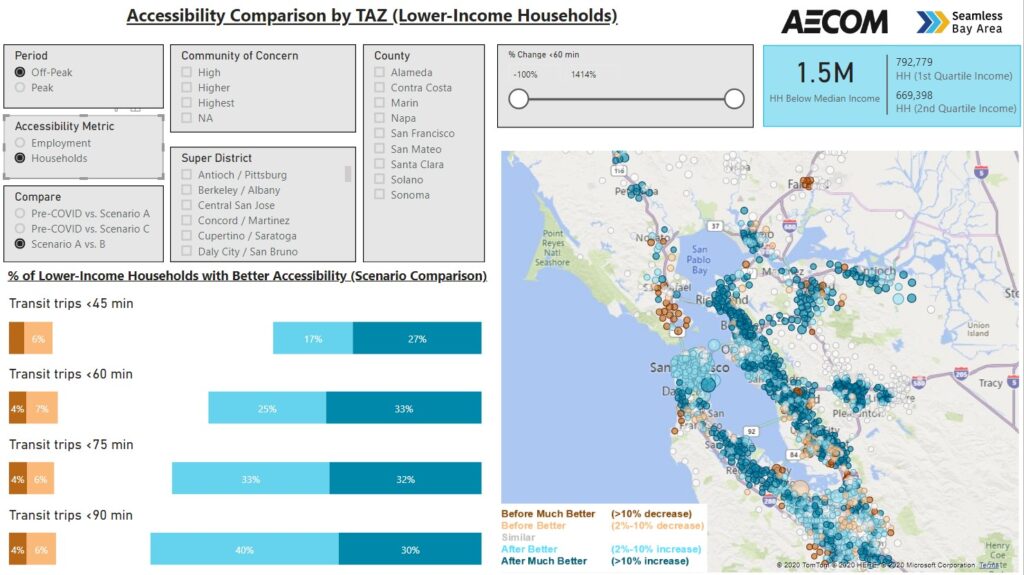
Figure 5. AECOM developed a dashboard to present estimated outputs and how accessibility to both housing and jobs could be affected by service changes, enabling isolation of specific geographies, income levels, and transit trip durations.
Forecast Outputs and Considerations:
1. The next two years are critical to regional transit success.
The Mobilitics tool forecasted that whether a quick or cautious economic recovery is assumed, the pandemic could have a long-term dampening impact on transit ridership across all scenarios that were forecasted. However, if riders do not come back to transit in pre-pandemic numbers within the next two to three years, the economic and environmental costs could be significant. The differential between Scenario A (current network, low investment) and Scenario C (optimized core network, growing investment) could be significant: the combined cost of additional roadway traffic delays (Figure 6) and added congestion could amount to approximately $860 million to $1 trillion of lost economic productivity, and approximately 155,000 to 170,000 metric tons of additional carbon dioxide equivalent/vehicle/year.
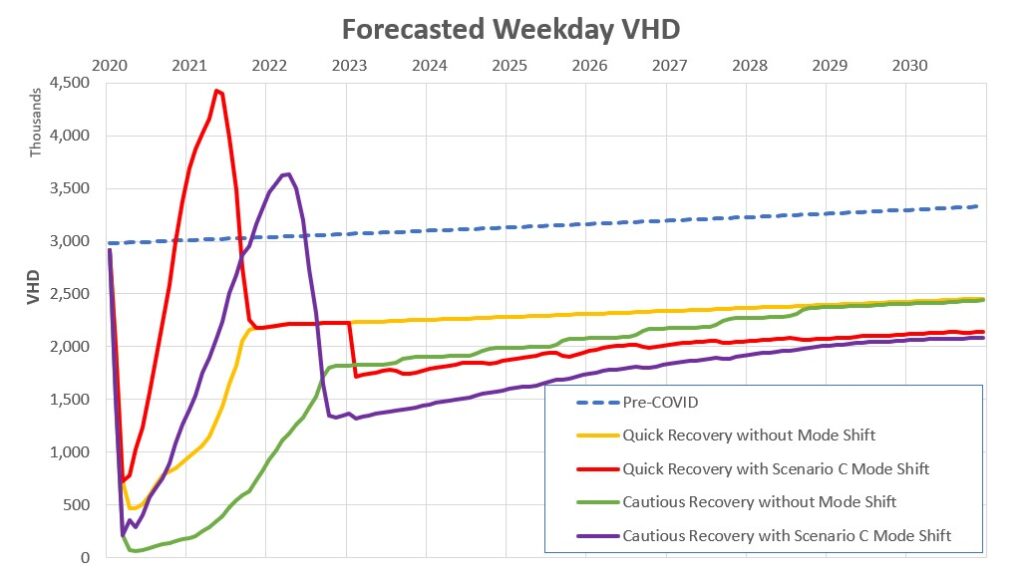
Figure 6. Mobilitics scenario planning outputs forecast that the impact of increased congestion could be most severe in the next two to three years if riders shift away from using transit, due to insufficient service or perceived lack of safety.
These forecasted outcomes based on our assumptions and possible transit scenarios underscore the importance of funding transit service throughout the pandemic to maintain service levels, alongside robust safety and customer communications programs to increase rider trust in transit and to promote faster recovery of ridership levels. Further detailed analysis will be required to fully quantify the impacts of COVID-19 on transit systems in the Bay Area in the near-, medium-, and long-term.
2. Overall accessibility can be expanded – to local and regional destinations – while keeping total service hours the same.
Our approach to network optimization deliberately held the region’s total transit operating service hours constant between Transit Scenarios A and B. This was done to forecast the potential gains that could be achieved without substantial additional funding for capital improvements or expansions, although this could require changes in agency coordination and operation cost management. For Transit Scenario B, the team modified service across the region without being restricted by existing agency boundaries or modes, to forecast what a regionwide approach to service optimization driven by regional, rider-focused goals could look like.
The forecast outputs demonstrated that net improvements to accessibility may be possible with network redesigns. Under Scenario B, the optimized network, approximately 60 percent of lower-income households could experience improved accessibility to destinations within 60 minutes compared to Scenario A, the current network. By contrast, only 10 percent of lower-income households were forecasted to have worse accessibility under Scenario B than Scenario A, while approximately 30 percent could experience no change.
3. Equitable accessibility to local and regional destinations should be a lens for making decisions on how to provide service.
The team was specifically interested in how the scenarios could impact Communities of Concern. While Scenario B was forecasted to have a net positive impact on accessibility for trips originating in the region’s Communities of Concern, some communities were forecasted to have worse accessibility due to the network optimization service changes, as shown in Figure 7.
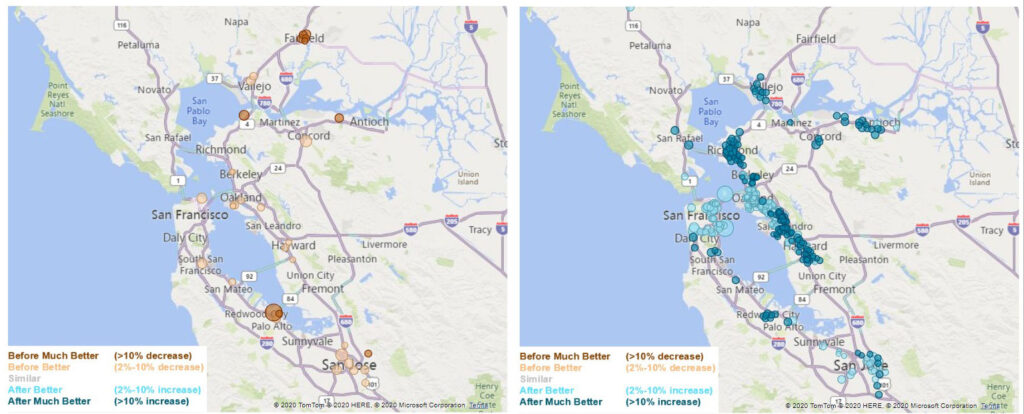
Figure 7. The GIS estimated outputs suggested that while approximately 30,000 households in Communities of Concern, or approximately 10%, (left) could have accessibility to fewer destinations within 90 minutes under Transit Scenario B (Optimized Network) compared to Transit Scenario A (June 2020 network), a much greater number – approximately 280,000 households or approximately 75% – could have accessibility to more destinations within 90 minutes in Scenario B than in Scenario A (right).
While the forecasts focused on regional impacts, a more detailed analysis of the local impacts of service changes on equity, including additional input from transit agencies and communities served, is recommended to be included in any significant network redesign. Service changes should consider not only accessibility for Communities of Concern, but also the destinations to which it is most important to maintain accessibility (e.g., hospitals, schools), and which job types should be prioritized for core network accessibility.
4. To realize the accessibility benefits of an optimized network, reduce disincentives to transfers.
The GIS and Mobilitics estimate and forecast outputs highlight the importance of streamlined transfers between transit services to maximize the accessibility benefits of the overall regional network and to make transit more appealing to elective riders. The current friction inherent in transfers among the 27 transit agencies (some with multiple transit services) could be reduced through the application of multi-agency strategies, such as more frequent service, aligned schedules at transfer points to reduce wait times, stops and stations designed to facilitate rider movement from one transit vehicle to another, and integrated fare policies to eliminate different fare structures and payment points.
Image source: Hiroko Koike, AECOM
5. Long-term funding sources need to do better than pre-coronavirus.
While the GIS estimated outputs showed that an optimized core network could provide near-term accessibility benefits, Mobilitics showed that long-term ridership recovery is forecasted to be strongly associated with overall service levels, underscoring the importance of increased funding – see Quick Recovery (Scenario C) and Cautious Recovery (Scenario C) scenarios in Figure 8. Scenario C (optimized core network + growing investment) was developed to forecast what a transformational influx of new funding – such as a new Bay Area tax measure – could mean for our transit future. Network optimization on a regional scale could make more efficient use of transit dollars, winning taxpayer confidence to maintain existing funding sources and support new tax measures.
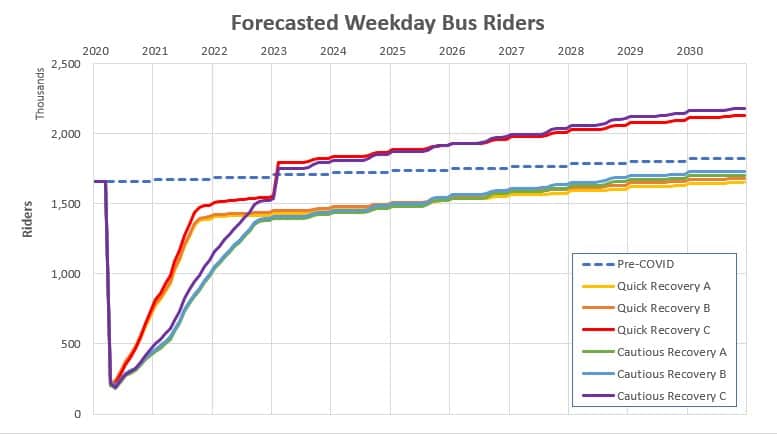
Figure 8. Over the longer term, increased investment is likely a primary determinant of increasing ridership above pre-coronavirus levels. Scenario C, assuming 135% of pre-coronavirus transit investment levels by 2030, is forecasted to result in significantly higher ridership than the other two scenarios tested (A and B), whether a quick or cautious economic recovery is assumed.
Next steps
The AECOM and Seamless Bay Area Transit Recovery Vision forecasts that a regionwide approach to service optimization and application of data analysis tools can generate forecast outputs that can help transit agencies and stakeholders make the difficult decisions that could guide Bay Area transit to recovery. On this basis, agencies, stakeholders, and decision makers can forecast possible impacts of additional scenarios and assumptions easily, as part of a comprehensive process, to work out the many details of redeploying service and regaining riders – and ultimately achieve their near-term recovery goals and long-term visions, and to realize the world-class transit system the Bay Area deserves.
To find out more, click here.
Disclaimer:
The scenario planning data in this article is intended for forecasting purposes only to demonstrate potential outcomes of proposed transit scenarios. This information should not be used to make funding decisions.
[1] http://mtc.legistar.com/gateway.aspx?M=F&ID=462e6d33-c92a-46bd-a7da-8c3fef243325.pdf
[2] Disadvantage factors include persons with limited English proficiency, zero-vehicle households, seniors aged 75 years and over, persons with one or more disability, single-parent families, and renters paying more than 50 percent of their household income on housing. Source: http://2040.planbayarea.org/sites/default/files/2017-07/Equity_Report_PBA%202040%20_7-2017.pdf
[3] Mobilitics™ is an AECOM trademark